
EDIT: The enhanced Creyos Health report is now available! Please download the updated results interpretation guide for further details. As always, if you have any questions or comments, do not hesitate to contact us.
Beginning in mid-November [2019], we are releasing an enhanced Creyos Health Report format.
One of the many advantages of being able to work with a community of leading brain health practitioners is that we are able to turn your feedback into continuous product enhancements and make Creyos Health as valuable as possible for your practice. Our science and product teams have incorporated your feedback into a redesigned and updated format that makes reporting more insightful and easier to interpret.
Features of the New Creyos Health Report
1. Evaluate performance at a glance with the new performance summary page and standard scores
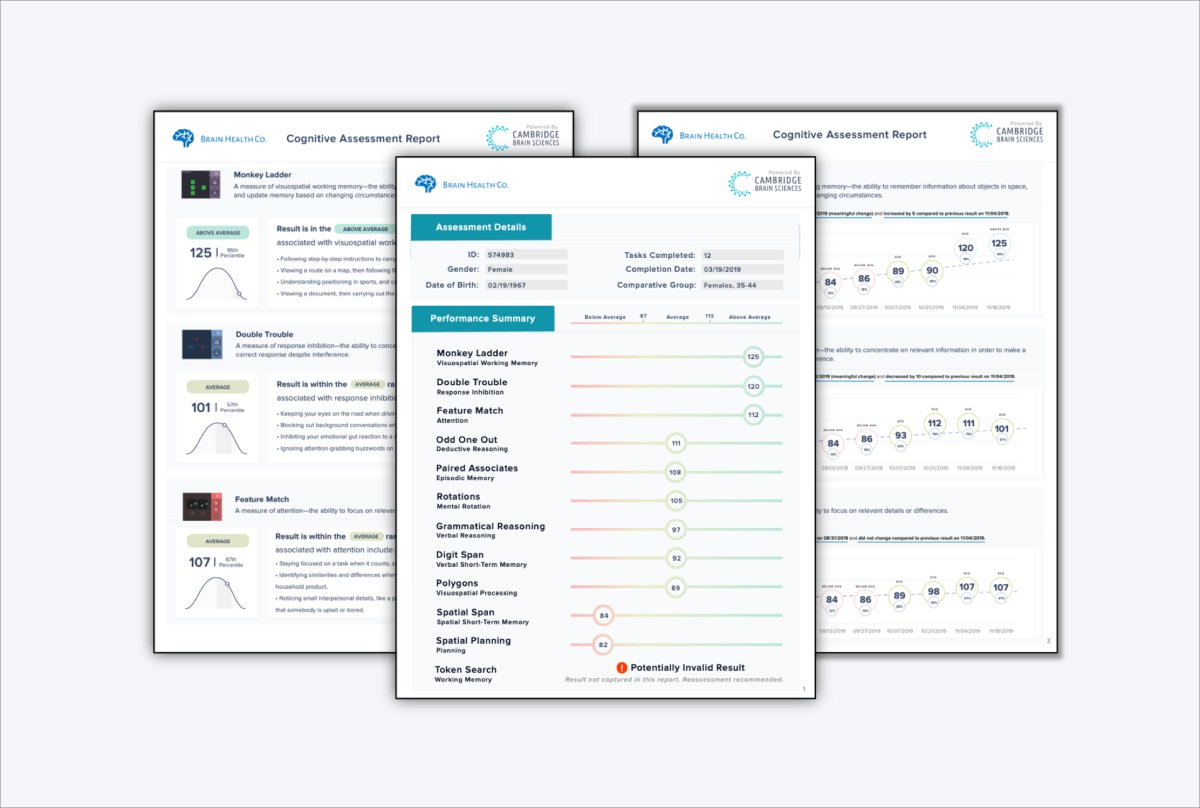
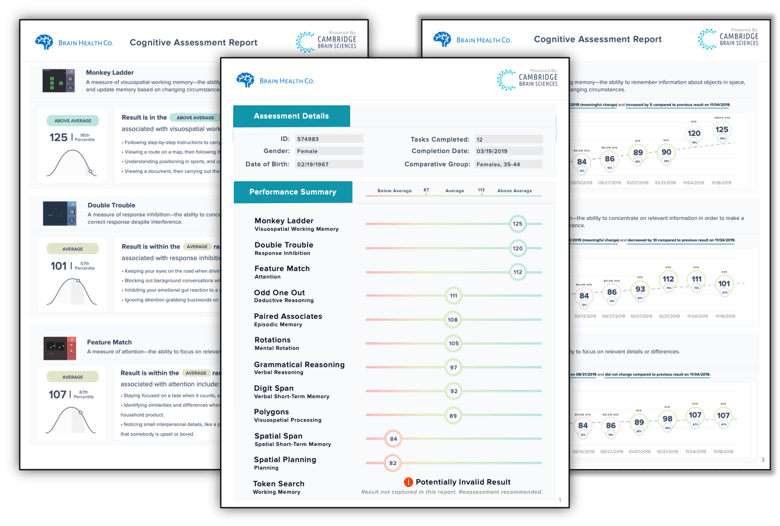
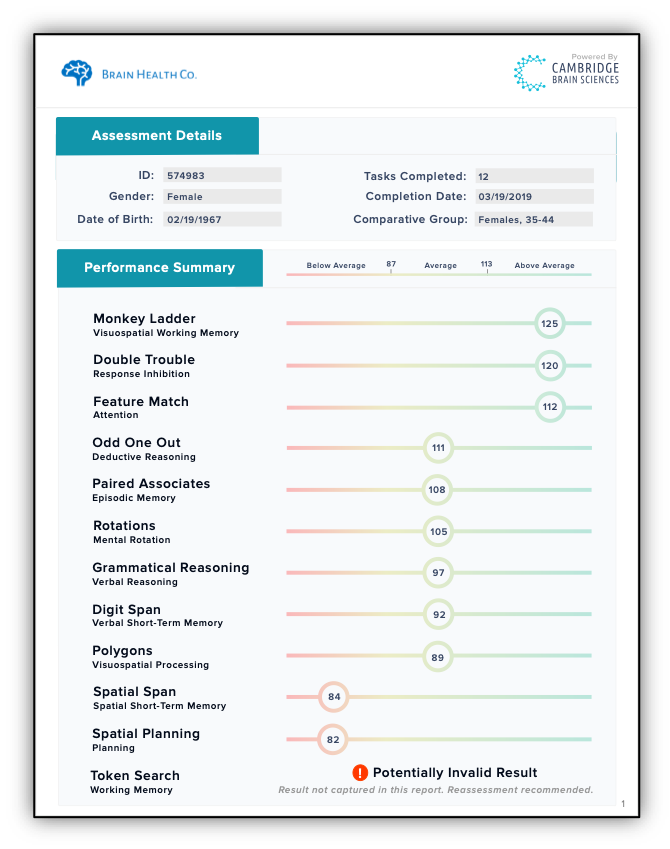
You can now quickly scan a performance summary page (see image below) for a snapshot of assessment results. Task scores have been standardized – replacing raw task scores – to allow you to more easily compare performance on different cognitive domains to each other.
2. Scores and percentiles are easier to interpret
An updated methodology for calculating and presenting performance data making data easier to interpret. Note that once this update is made, previous reports will also be updated to be in line with this methodology for consistency. If you have printed or saved any Creyos Health reports, you may see slight differences between percentiles on the old reports and newly-generated reports.
The key objective of this change is to reduce variability in outlier task scores that may occur due to chance alone, thereby making the results easier to interpret and explain to patients. The Creyos database contains millions of task scores, enabling us to calculate exactly how scores fluctuate over time and adjust for the role of chance outliers. The end result is ‘adjusted scores’ that are more likely to be reflective of a patient’s genuine performance.
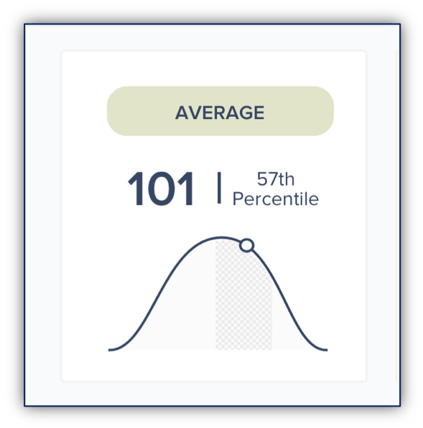
- Moving forward, percentiles will be shown as a range or area under the bell curve that is most indicative of the individual’s capabilities. We will report the midpoint of that area as the percentile rank, as illustrated below:
- Both standard scores and percentiles will be more reliable over time. The report now adjusts for regression to the mean—the tendency for an outlier score to return to a more moderate level the next time the task is administered. The result is fewer unexplained peaks and valleys, with more focus on genuine cognitive trends. As always, the meaningful change indicator will also highlight changes from one score to the next that are unlikely to be due to chance alone.
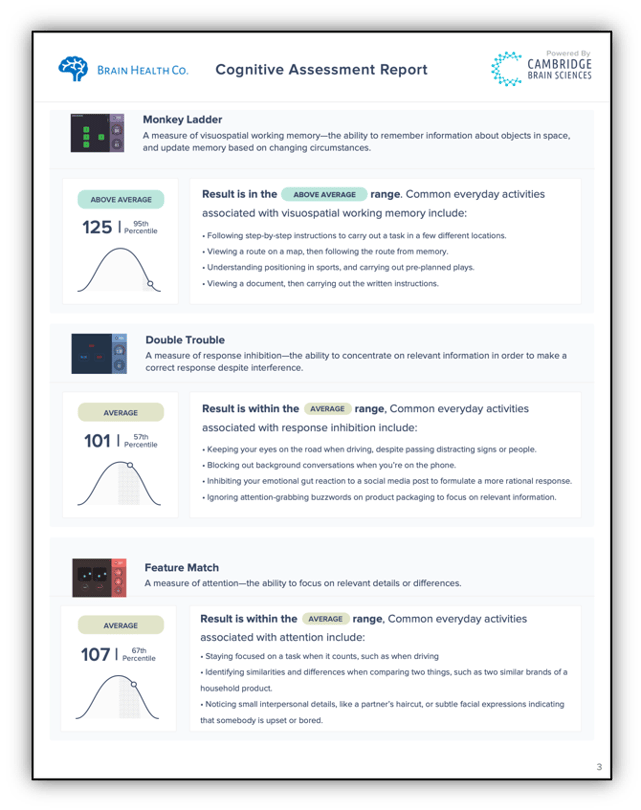
3. Reports provide greater real-world context to ensure results are more relatable and better understood
The first time an individual completes a task, their report will contain a description of common everyday activities that are associated with the tasks they complete. Furthermore, there are two different sets of example activities depending on the age of the individual being assessed (individuals who are 18 years or younger will see example activities more relevant to youth, and those above 18 years of age will view adult activities).
The report will feature these descriptions on each individual task result block the first time an individual completes a task. An example is provided below.
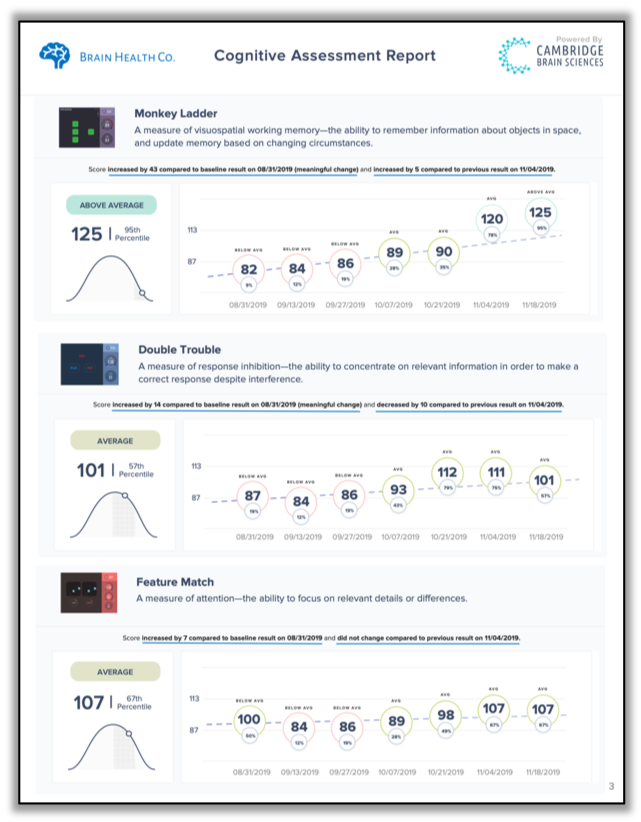
4. Easily interpret longitudinal performance trends with a new trends chart
Aside from an easier-to-read design, the new trends chart will include a line of best fit, along with standard scores, percentile ranks, classifications, and assessment dates for each time point. Measures of meaningful change will also be noted if detected, as shown below:
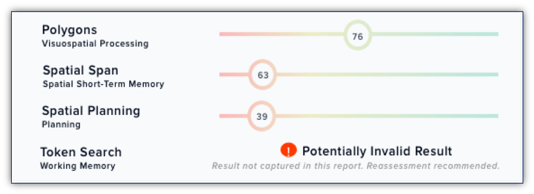
Bonus: easily reassess potentially invalid tasks
The summary page will clearly highlight when a task result is indicative of a potentially invalid score:
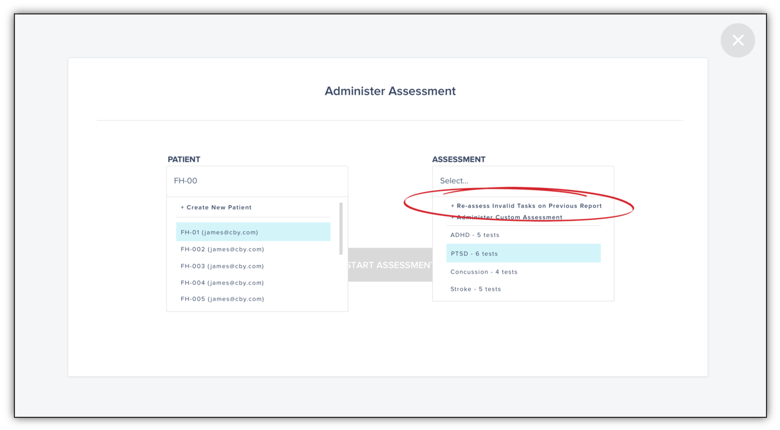
You will then be able to re-assess a potentially invalid score within a 48-hour window, and have it replace the previous result on the same report. You will no longer have to download two separate reports to account for tasks that were retaken due to being flagged as potentially invalid:
Have questions?
If you have any questions, comments, or feedback, feel free to comment on this article or contact us directly. You may also sign up for a webinar next week, in which members of our product and science teams will walk through these changes in further detail. As always, we are looking forward to hearing your feedback.
Thanks,
- Creyos Team