The Creyos Health Report
Published: 25/11/2025 | 3 min read
Written by: Dayna Lang, Content Marketing Manager at Creyos
Reviewed by: Mike Battista, Director of Science & Research at Creyos
Clear and accurate reports are essential for making informed clinical decisions quickly to enable early intervention and effective care planning. Precise reporting provides comprehensive documentation, reduces administrative time, and delivers easy-to-read reports for simple interpretation of scores and sharing results with patients.
The Creyos Health report is clear and easy to interpret, allowing detailed insights into cognitive function to be quickly reviewed and shared with patients.
Creyos reports distill in-depth data derived from patient cognitive performance into actionable information that supports confident clinical decision-making. A clear picture of cognitive and behavioral health informs and supports providers in making accurate diagnoses, tailoring care, and tracking disease progression and treatment efficacy.
Reports from Creyos are instantly generated with the completion of each assessment, reducing administrative burden and saving you valuable time better spent face-to-face caring for patients
Easy interpretation and instant scoring are just the start. Creyos reports are also detailed and precise, making it easy to keep your documentation up-to-date and compliant.

Creyos Report Features
Summary Page and Standard Scores
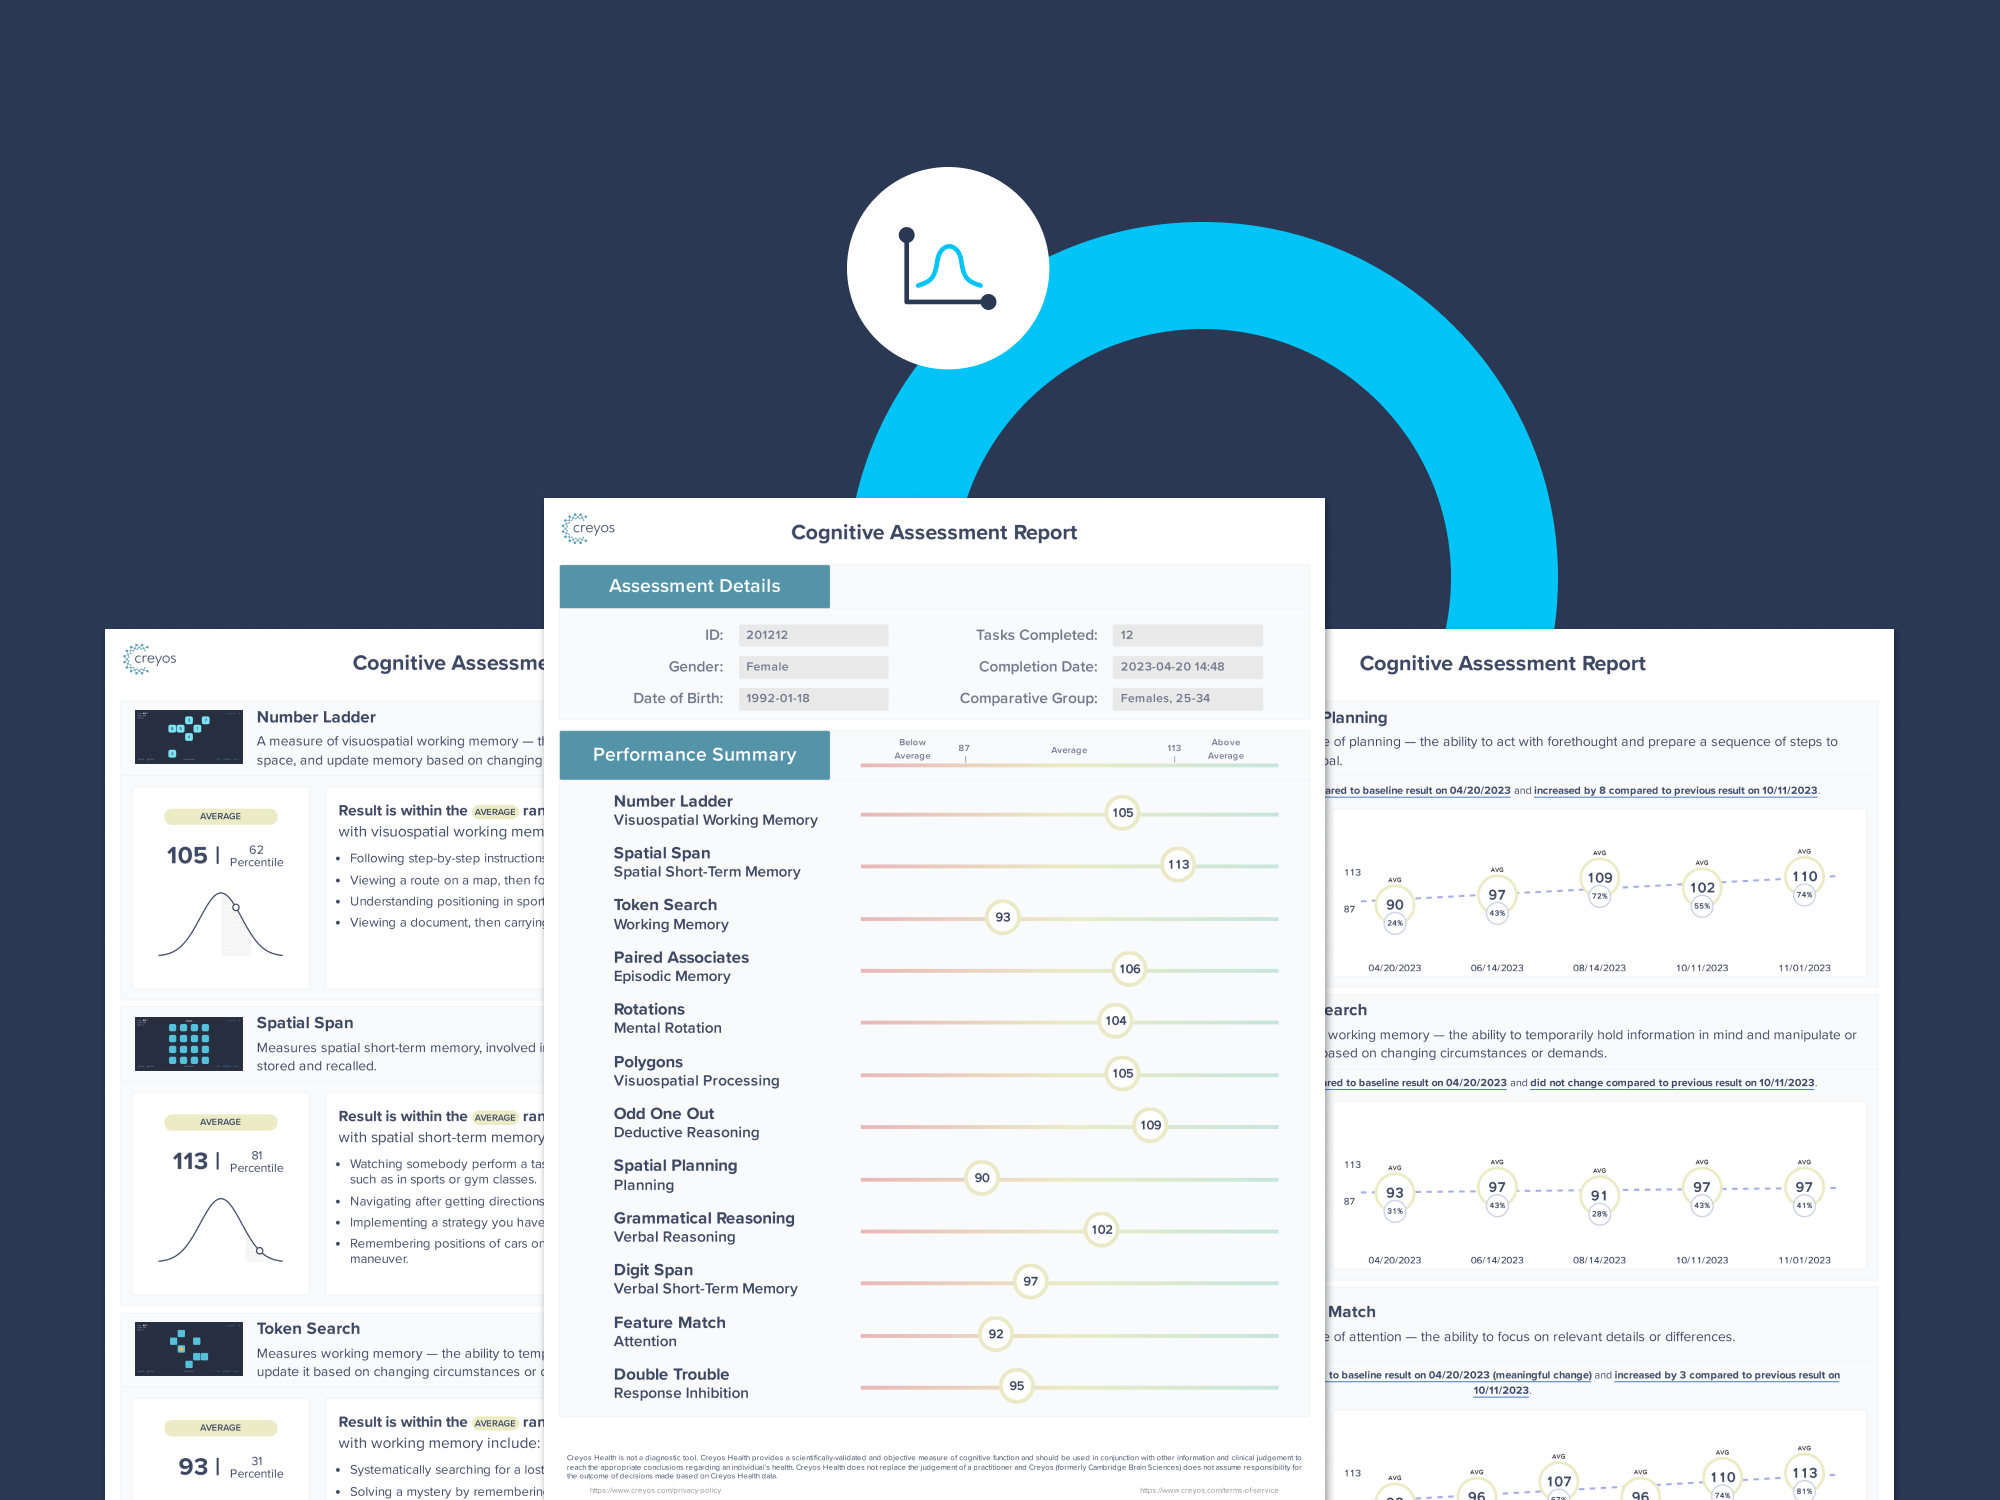
Evaluate performance at a glance with the performance summary page and standard scores. You can quickly scan a performance summary page for a snapshot of assessment results. You can read more about the summary page in the Creyos Health Report Interpretation Guide.
Task scores are also standardized to allow for easy performance comparison with age and gender-matched norms across different cognitive domains. Creyos leverages a normative database of over 85,000 individuals to ensure reliable results tailored to each patient.

Scores are Clear and Accurate
Creyos makes results easier to interpret without sacrificing accuracy. The scores in the report are adjusted to reduce effects of chance and better estimate the “true” score of each patient. In particular, the results account for regression to the mean—a phenomenon describing the tendency for an extreme score to be closer to the mean the next time the task is completed.
This means that extremely high or low scores are less likely to be a result of chance. Because of the size of the Creyos database, predictions are highly accurate and based on known properties of each task.
Scientific validity is non-negotiable. That’s why Creyos draws on one of the world’s largest normative databases of over 85,000 participants across different ages, genders, geographies, and education levels to pinpoint meaningful score changes over time and account for random variability. This allows reports to present adjusted scores that more accurately reflect a patient’s true cognitive performance.

You can download the results interpretation guide for a detailed walkthrough of how to interpret the Creyos cognitive report.
Translating Cognitive Test Results Into Clinical Meaning
Creyos reports provide real-world context to help patients and providers understand the results of the assessment. On initial assessment reports, each task includes examples of everyday activities associated with the cognitive areas being measured, making the findings easier to understand and to apply practically.

Longitudinal Monitoring
Providers can easily interpret longitudinal trends with automatically generated performance trends. Trends include a line of best fit, along with standard scores, percentile ranks, classifications, and assessment dates for each time point. Measures of meaningful change are also flagged.

Easily Reassess Potentially Invalid Tasks
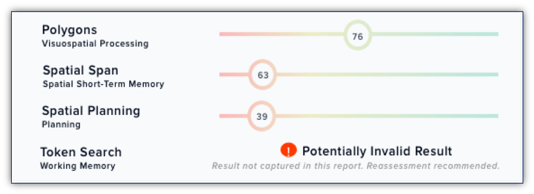
The summary page clearly highlights when a task result is marked as potentially invalid, meaning there may be unusual performance patterns impacting the result.

Key Takeaways
Seamless, precise, and easy-to-interpret clinical assessment results are critical for efficient and effective patient care.
Creyos reports are:
- Scientifically validated and reliable across diverse patient populations
- Precise and offer detailed insights across multiple areas of cognition
- Easy-to-interpret and offer real-world context
- Instantly scored for fast insights and documentation
Providers looking for advanced cognitive data without adding administrative burden can rely on Creyos reports to deliver fast, accurate, and scientifically grounded insights. This reporting process enhances workflows, reduces documentation time, and frees providers to focus on what matters most: delivering high-quality care to their patients.
 Reviewed by Mike Battista, Director of Science & Research at Creyos
Mike Battista specializes in brain health, cognition, and neuropsychological testing. He received his PhD in personality and measurement psychology at Western University in 2010 and has been doing fun and useful stuff in the intersection between science and technology ever since.

